
China Pickup Export Market — Jan–Jul 2026
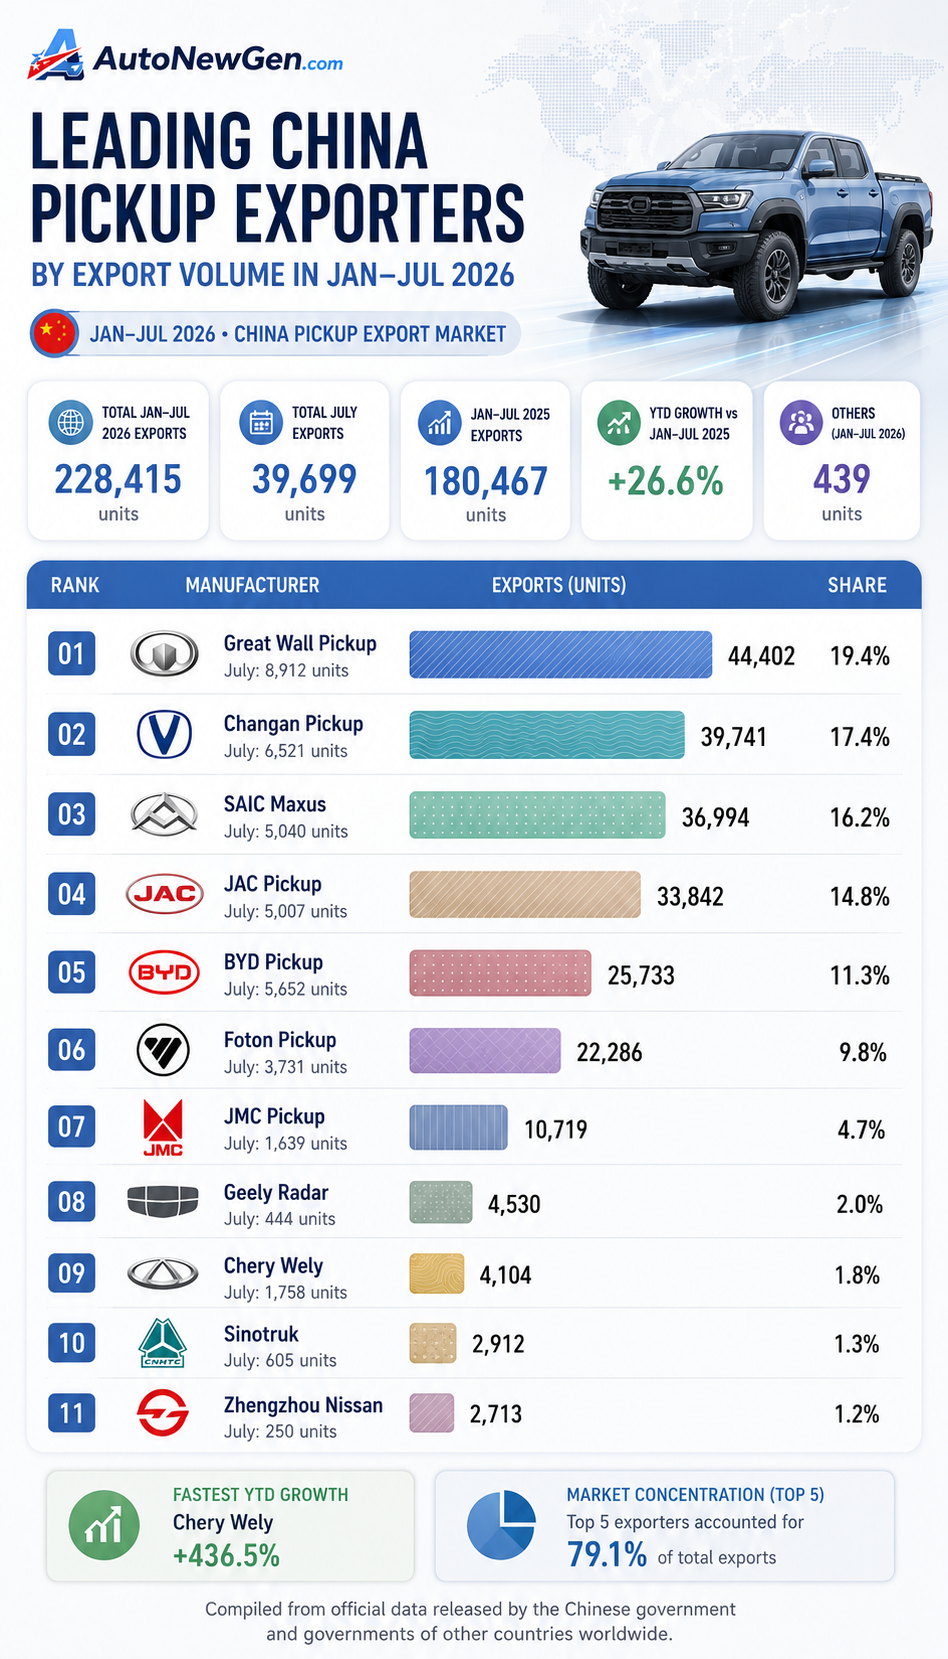
China’s pickup-truck exports continued to expand in the first seven months of 2026, with total shipments reaching roughly 228,000 units, up about 26.6% from the same period a year earlier. July alone contributed nearly 40,000 units, underscoring the growing importance of overseas markets for China’s pickup manufacturers.
Great Wall Motor remained the largest exporter by a clear margin, shipping more than 44,000 pickups between January and July and accounting for about 19.4% of the total. Changan ranked second with nearly 40,000 units, followed by SAIC Maxus and JAC, both of which exported more than 30,000 vehicles during the period.
The market remains relatively concentrated. The five largest exporters — Great Wall, Changan, SAIC Maxus, JAC and BYD — together represented close to four-fifths of China’s pickup exports. BYD ranked fifth with more than 25,000 units, reflecting the company’s growing presence in the segment as it expands its plug-in hybrid pickup business across overseas markets.
Growth rates also point to a rapidly changing competitive landscape. Chery recorded the fastest year-on-year expansion from a relatively low base, while BYD, Changan and Foton posted strong growth. JMC also delivered solid gains. By contrast, some established exporters faced weaker momentum, highlighting increasingly uneven performance across Chinese pickup brands.
China’s pickup export market is becoming more strategically important as domestic manufacturers broaden their presence beyond traditional destinations. Latin America, the Middle East, Australia, Southeast Asia and parts of Africa remain important markets, while electrified pickups are opening another avenue for Chinese brands to compete in a segment historically dominated by Japanese and American manufacturers.
Data note: The visualization is compiled from official data released by the Chinese government and governments of other countries worldwide. Figures shown in the graphic may include minor adjustments within ±0.35% for visualization purposes, without affecting the actual ranking or overall market trend.